
Off-the-shelf forecasting tools were trained on Western seasonality and Western holidays. They systematically misshape Indian festival demand — and the fix isn't a better model, it's the right features.
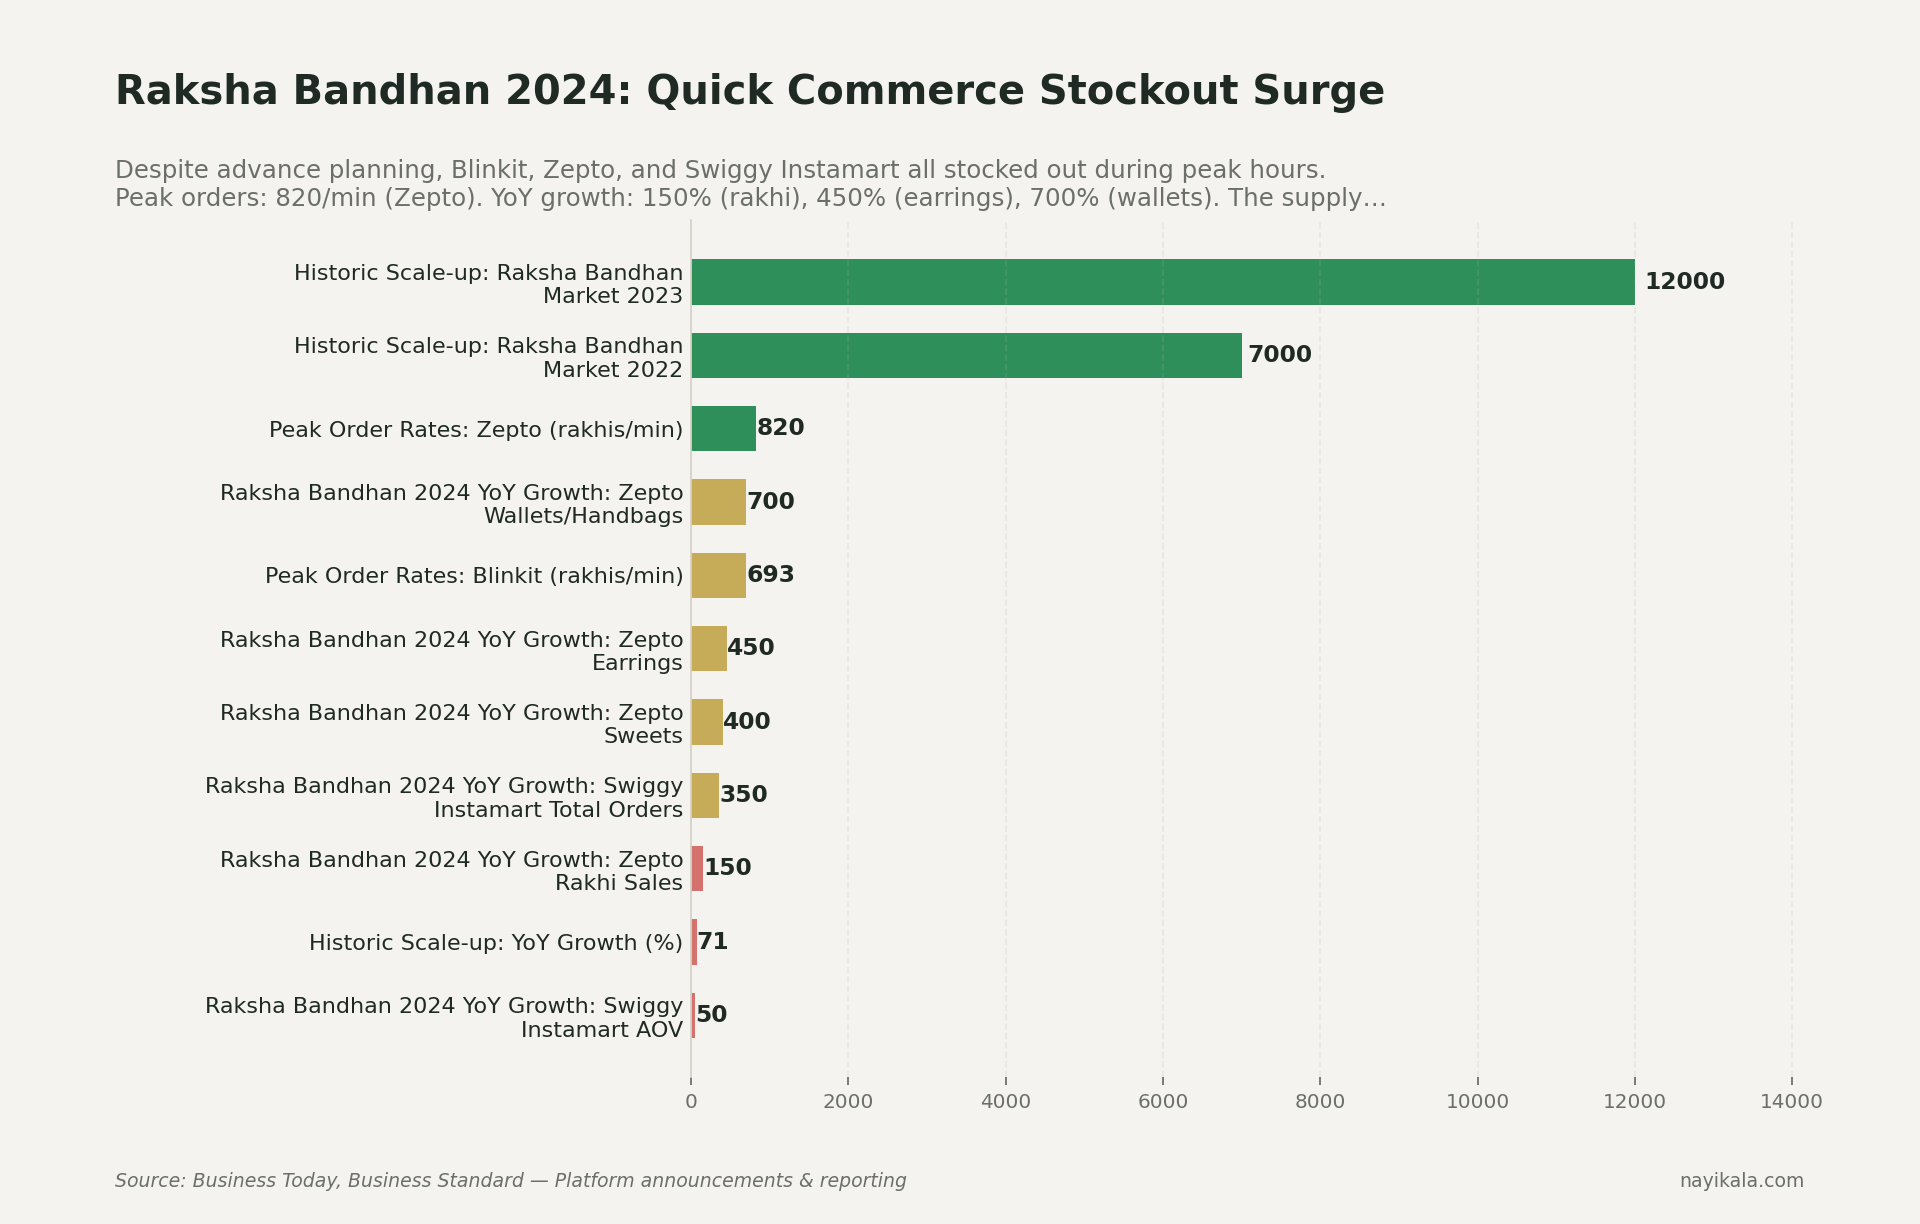
It's August 19, 2024. Raksha Bandhan morning. A founder watches her Blinkit listing for premium rakhis flick from "in stock" to "out of stock" at 10:47 AM. By 11 AM, every QC platform — Blinkit, Zepto, Swiggy Instamart — is OOS on rakhis in most pincodes. Zepto sold 820 rakhis per minute at peak (Business Today). Swiggy Instamart did 5× the rakhis on a single day that it did across the entire previous year. Blinkit's CEO publicly called it an "all-time high."
This is not a celebration story. This is what failure to forecast a known, dated, annual spike looks like — at companies with the best forecasting infrastructure in Indian commerce.
Now ask yourself: if Zepto missed Raksha Bandhan, what is your Prophet model — running on two years of Shopify data with holidays_country='IN' — doing about Diwali this October?
The model isn't the problem. The features are.
Most Indian D2C and SME founders we talk to are running one of three things: Excel + gut, a SaaS OMS like Unicommerce that does basic trend extrapolation, or a Python notebook with Prophet that someone's analyst built. All three break on Indian seasonality for the same reason — and it has nothing to do with the algorithm.
Prophet's holiday handling is built around a symmetric window assumption: lower_window=-3, upper_window=3 around a date, with a single coefficient. That model says: "demand is elevated for a few days around the holiday, with the peak on the day itself." This is approximately true for Christmas. It is approximately false for almost every Indian festival.
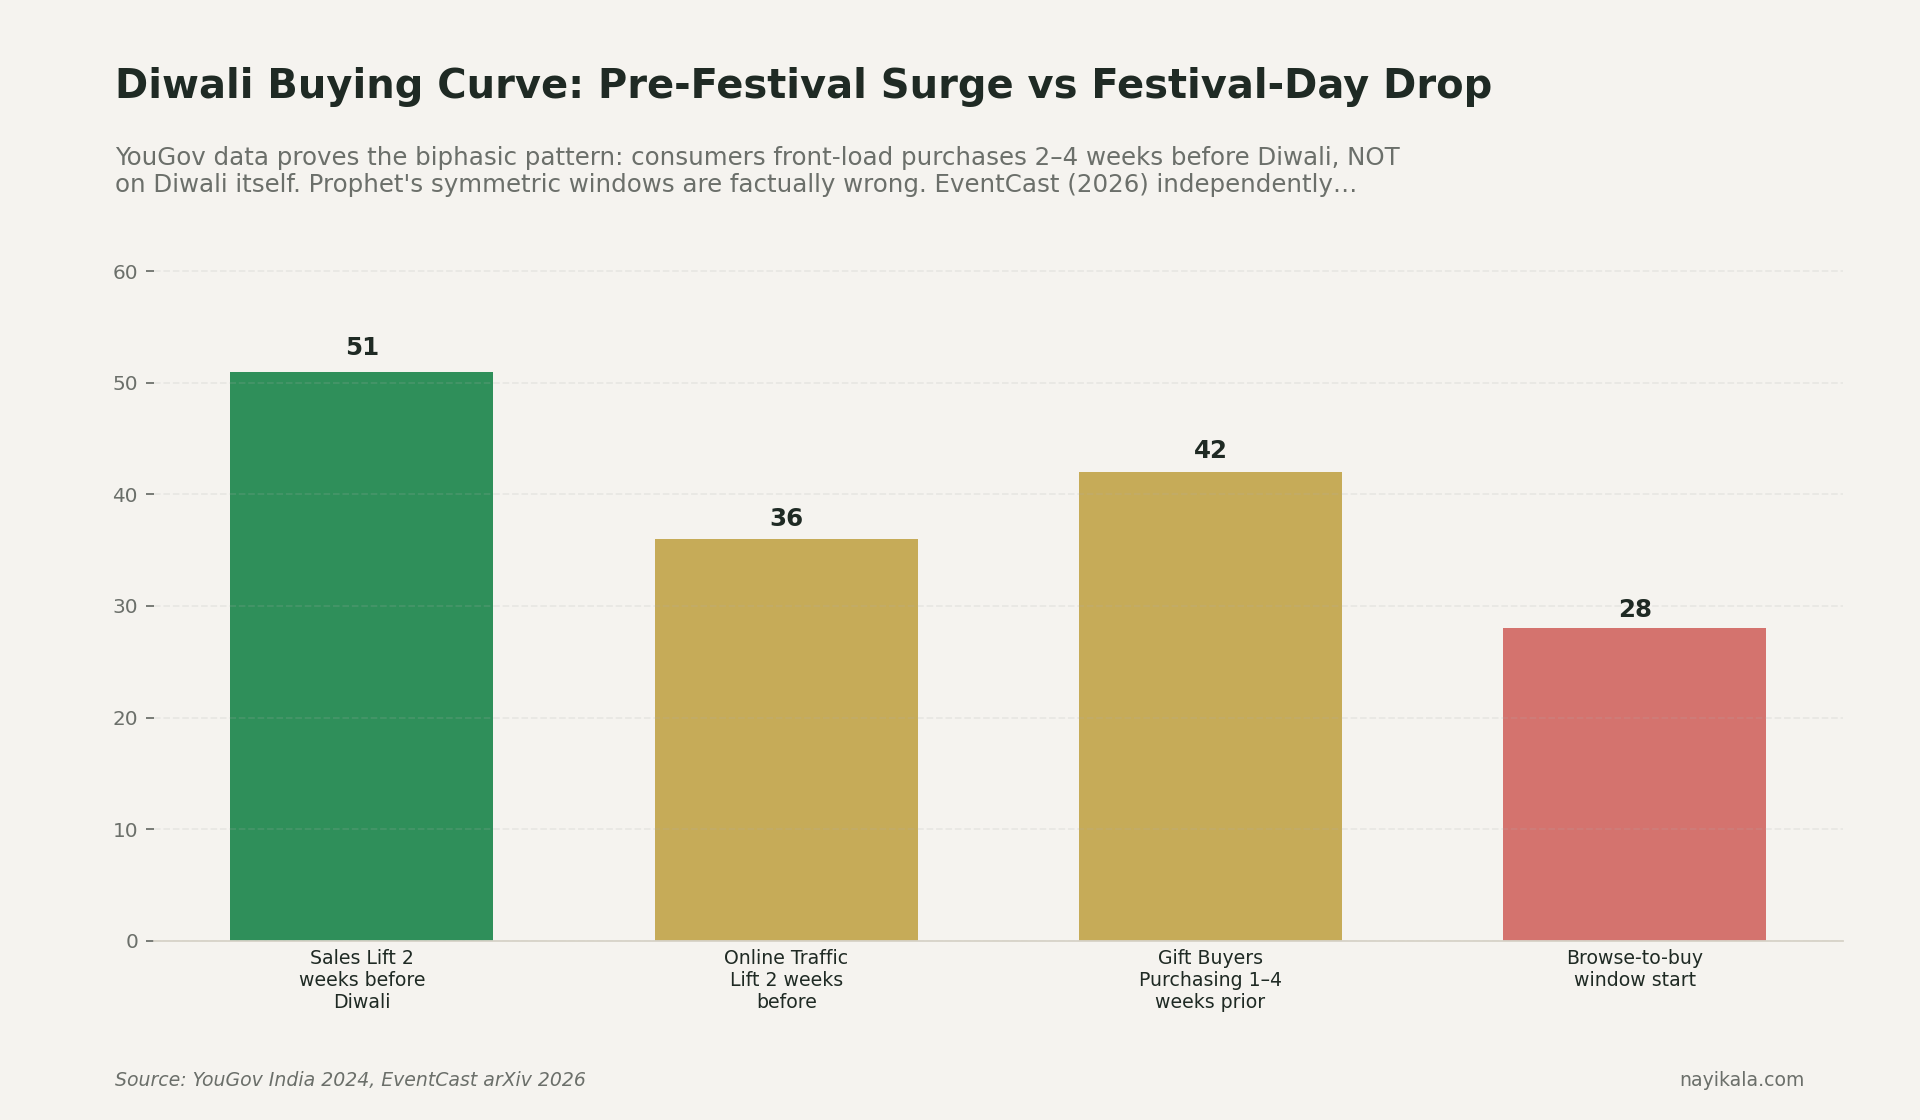
The EventCast paper deployed across 4 countries and 160 regions in 2026 measured this empirically. Religious and cultural holidays — about 15% of all events in their taxonomy — show a biphasic pattern: a pre-festival surge followed by a during-festival drop. Indian Diwali is the textbook case. YouGov India 2024 put hard numbers on it: sales lift in the two weeks before Diwali was +51%; 42% of gift buyers complete their purchase 1-4 weeks before. On Diwali day itself, many categories drop — people are lighting diyas, not browsing Myntra.
A symmetric Prophet window around November 1 doesn't model that. It smears a bell curve over the date and silently underpredicts the pre-festival ramp while overpredicting day-of demand. Your inventory plan inherits the shape of that smear.
Indian festival demand is multiplicative, not additive
This is the structural one. Prophet's default is seasonality_mode='additive' — which means a Diwali bump is modeled as a constant +500 units regardless of whether your daily baseline is 200 or 2,000. Sounds reasonable until you grow.
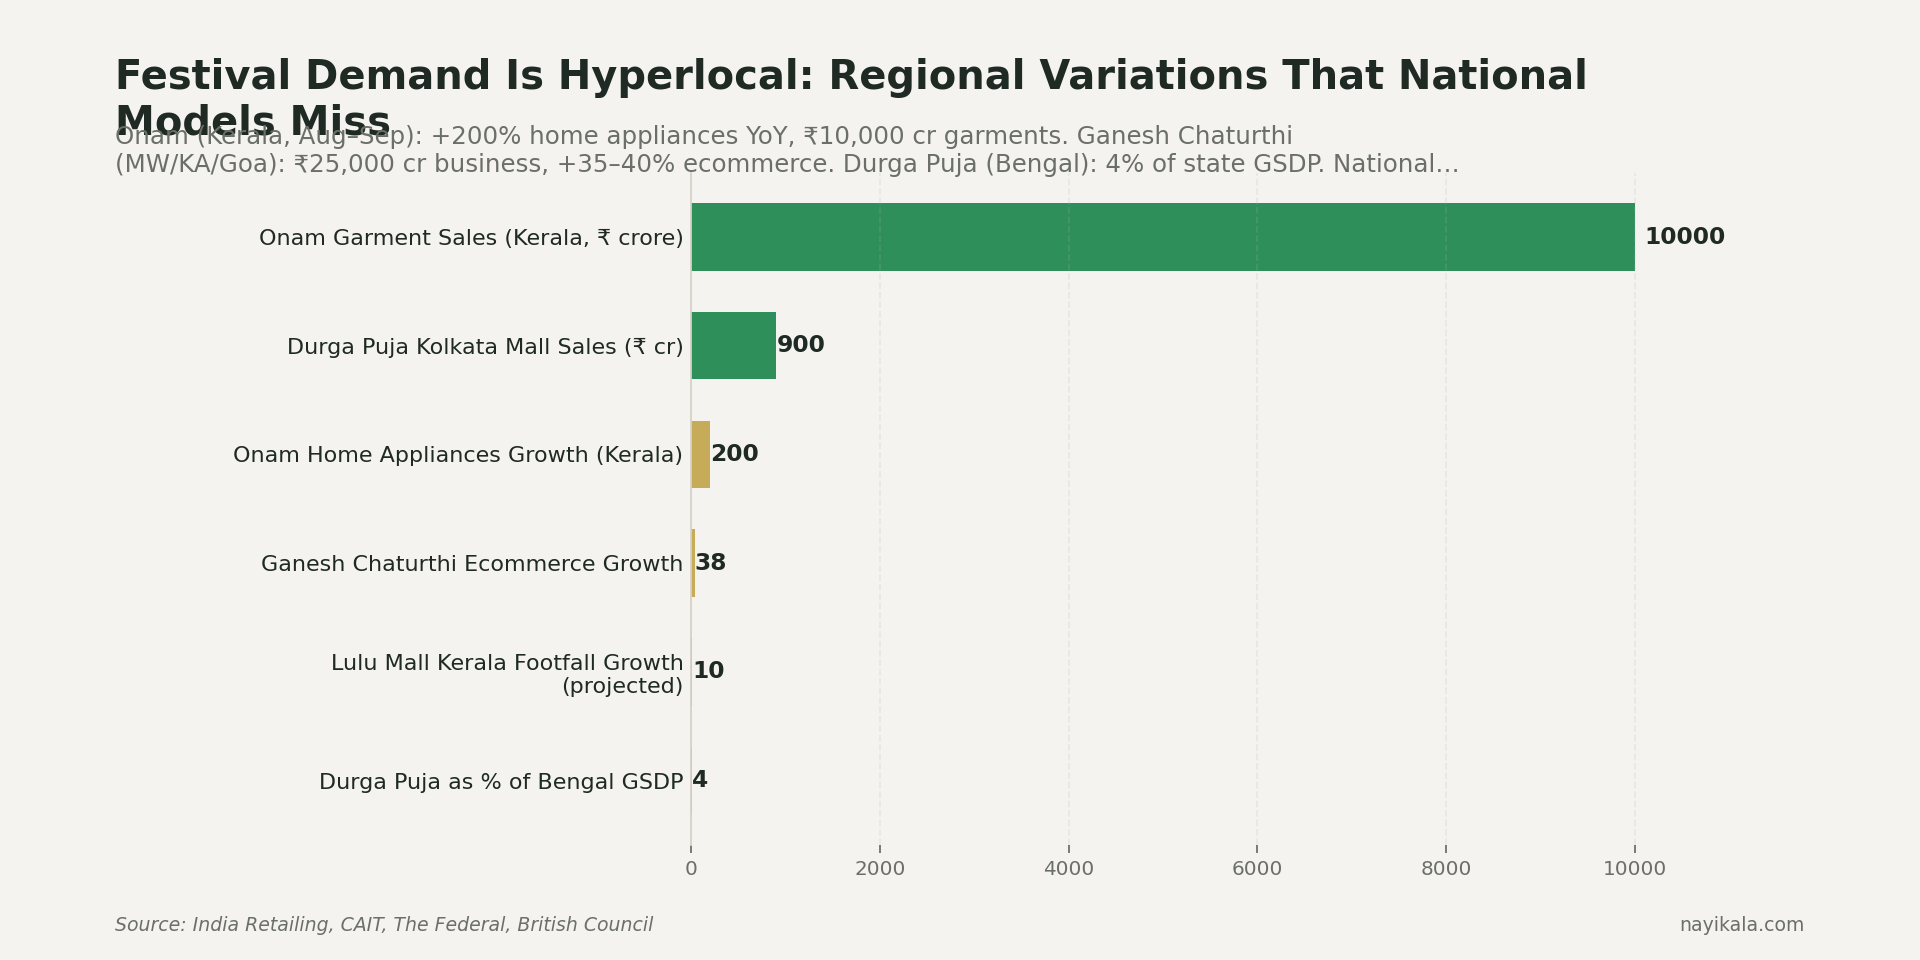
Diwali demand isn't +500 units. It's 3.5× BAU at the aggregate (RedSeer's 2025 explicit number for festive vs business-as-usual). Within that, fashion runs at 3× yearly average. Travel accessories were +250% YoY festive 2024 (Unicommerce). Premium fashion + beauty on Amazon spiked +400% festive 2024 (eMarketer). Onam in Kerala lifted home appliance sales +200% YoY in that single state — invisible in any national-aggregate model (India Retailing).
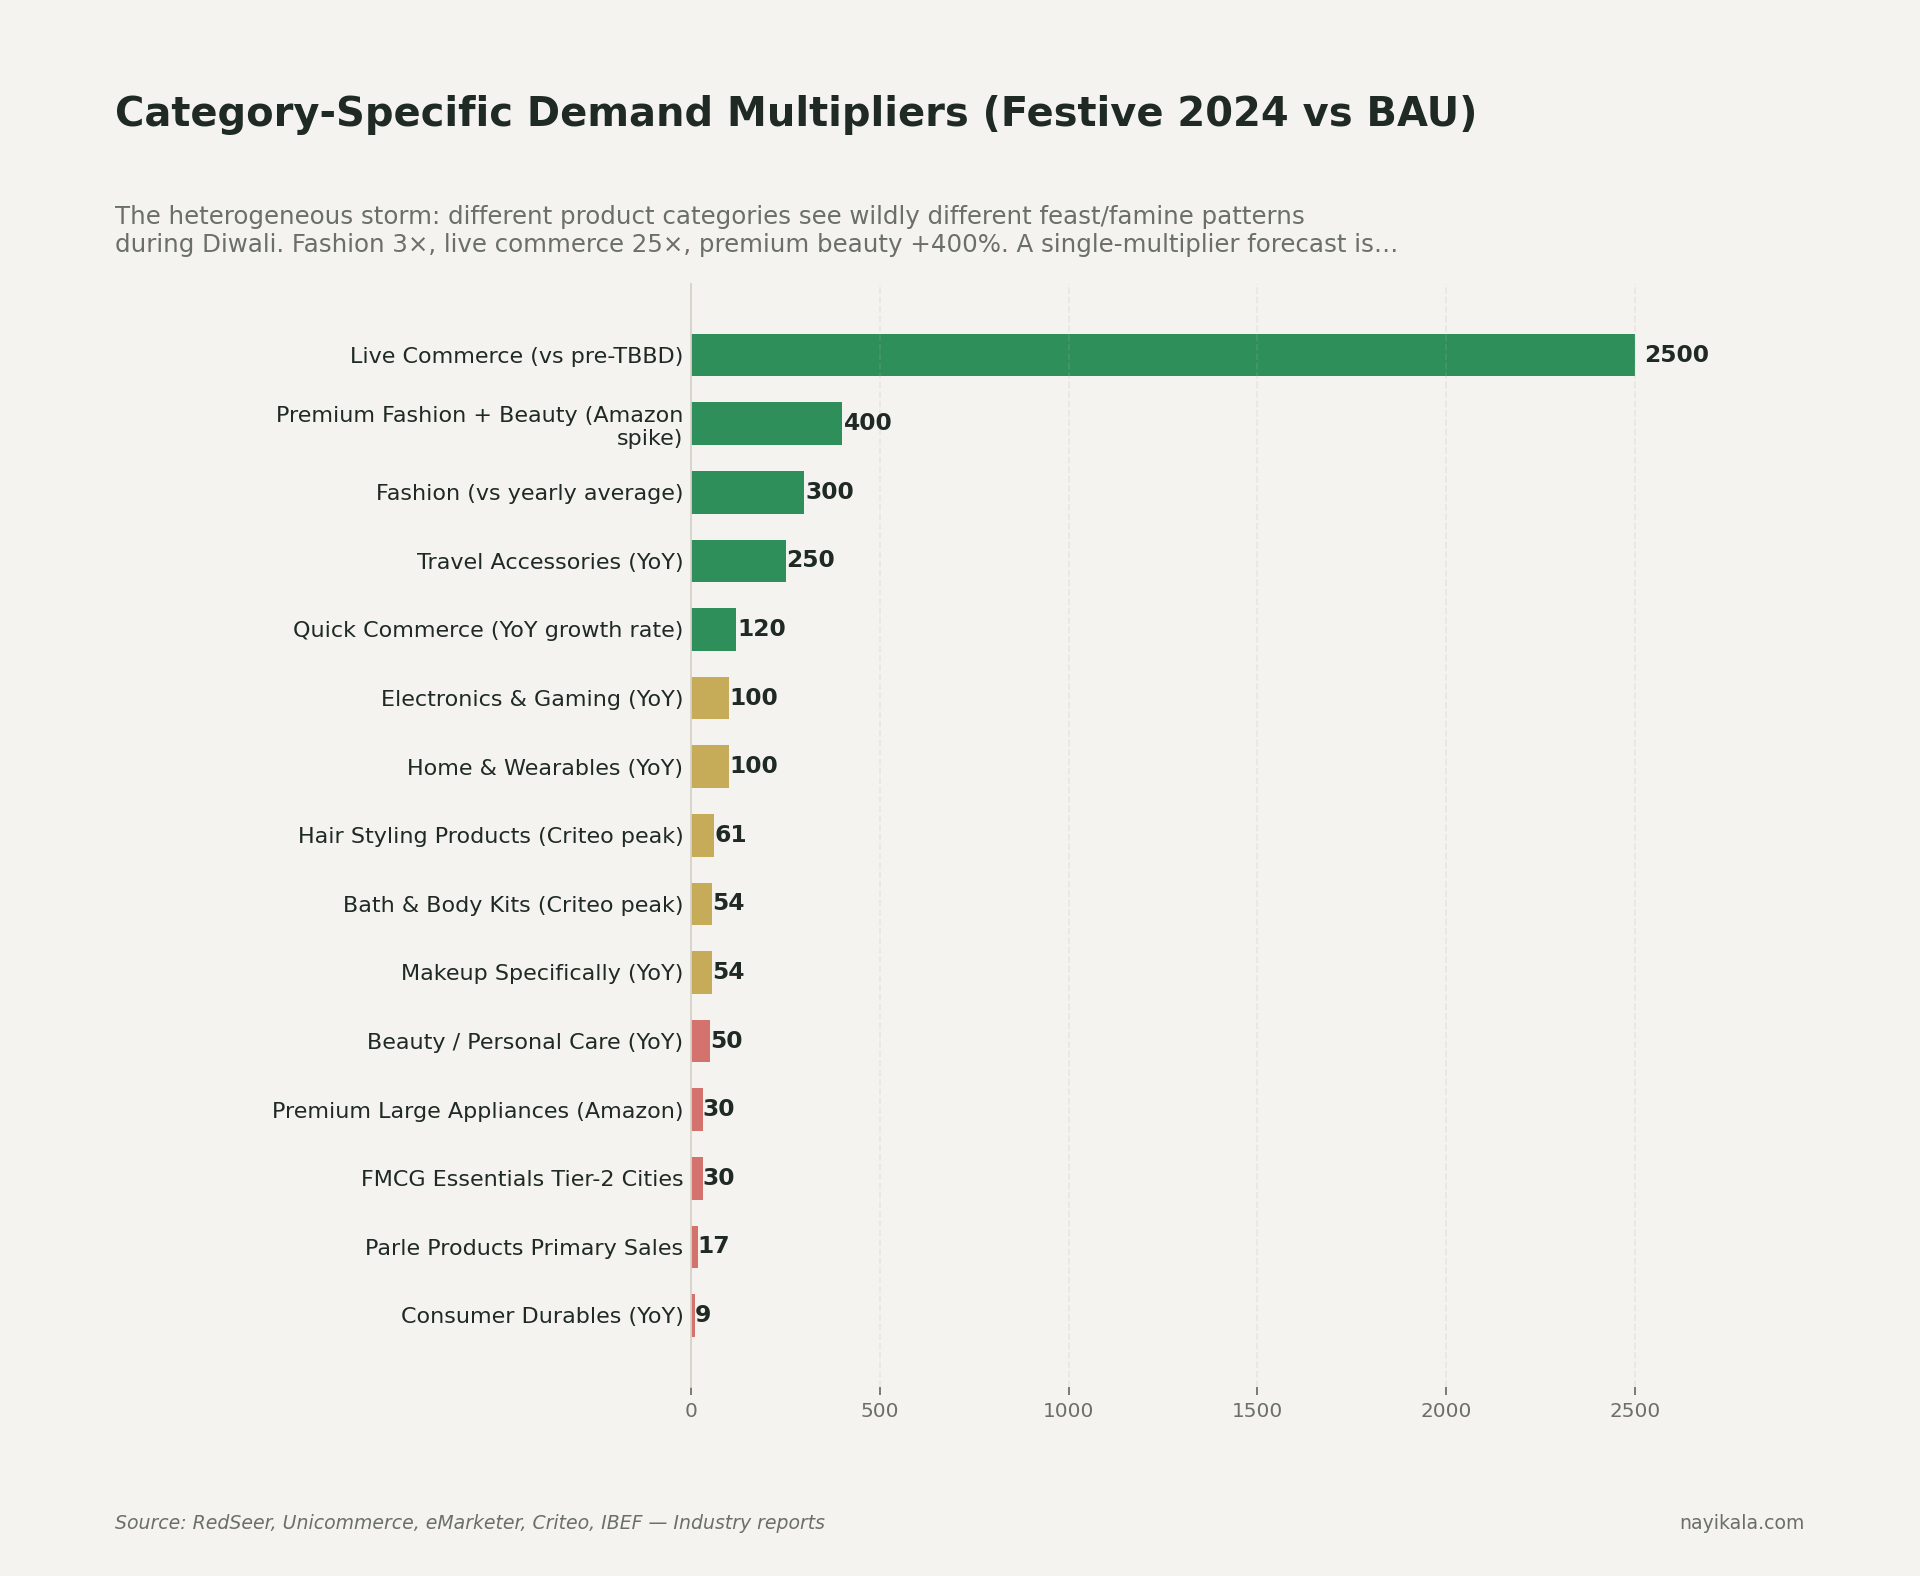
These are multiplicative effects. The fix in Prophet is one line — seasonality_mode='multiplicative'. On the pipelines we've audited, switching from additive to multiplicative produced bigger error reductions than swapping the model out for NeuralProphet — a one-line change beating a library swap. Most analyst-built Prophet pipelines we've inspected at SMEs have never flipped that flag.
The deeper problem: Prophet's bell-curve Fourier decomposition cannot represent the cliff edge that follows Diwali. Demand for sweets, gifting, electronics goes from 5× to baseline in 24 hours. There is no smooth seasonal function in Prophet's vocabulary that captures a cliff. The library will fit something that looks plausible and is wrong on both sides of the discontinuity.
SARIMA's moving holiday problem, and why Amazon Forecast isn't your way out
SARIMA's seasonal period is fixed — period=52 for weekly, period=365 for daily. Eid shifts ~11 days every Gregorian year. Diwali shifts up to four weeks. Holi, Navratri, Onam — all lunar, all moving. A festival that lands in week 44 this year and week 41 next year will never align inside SARIMA's fixed seasonal structure. No tuning fixes this. The model is structurally blind.
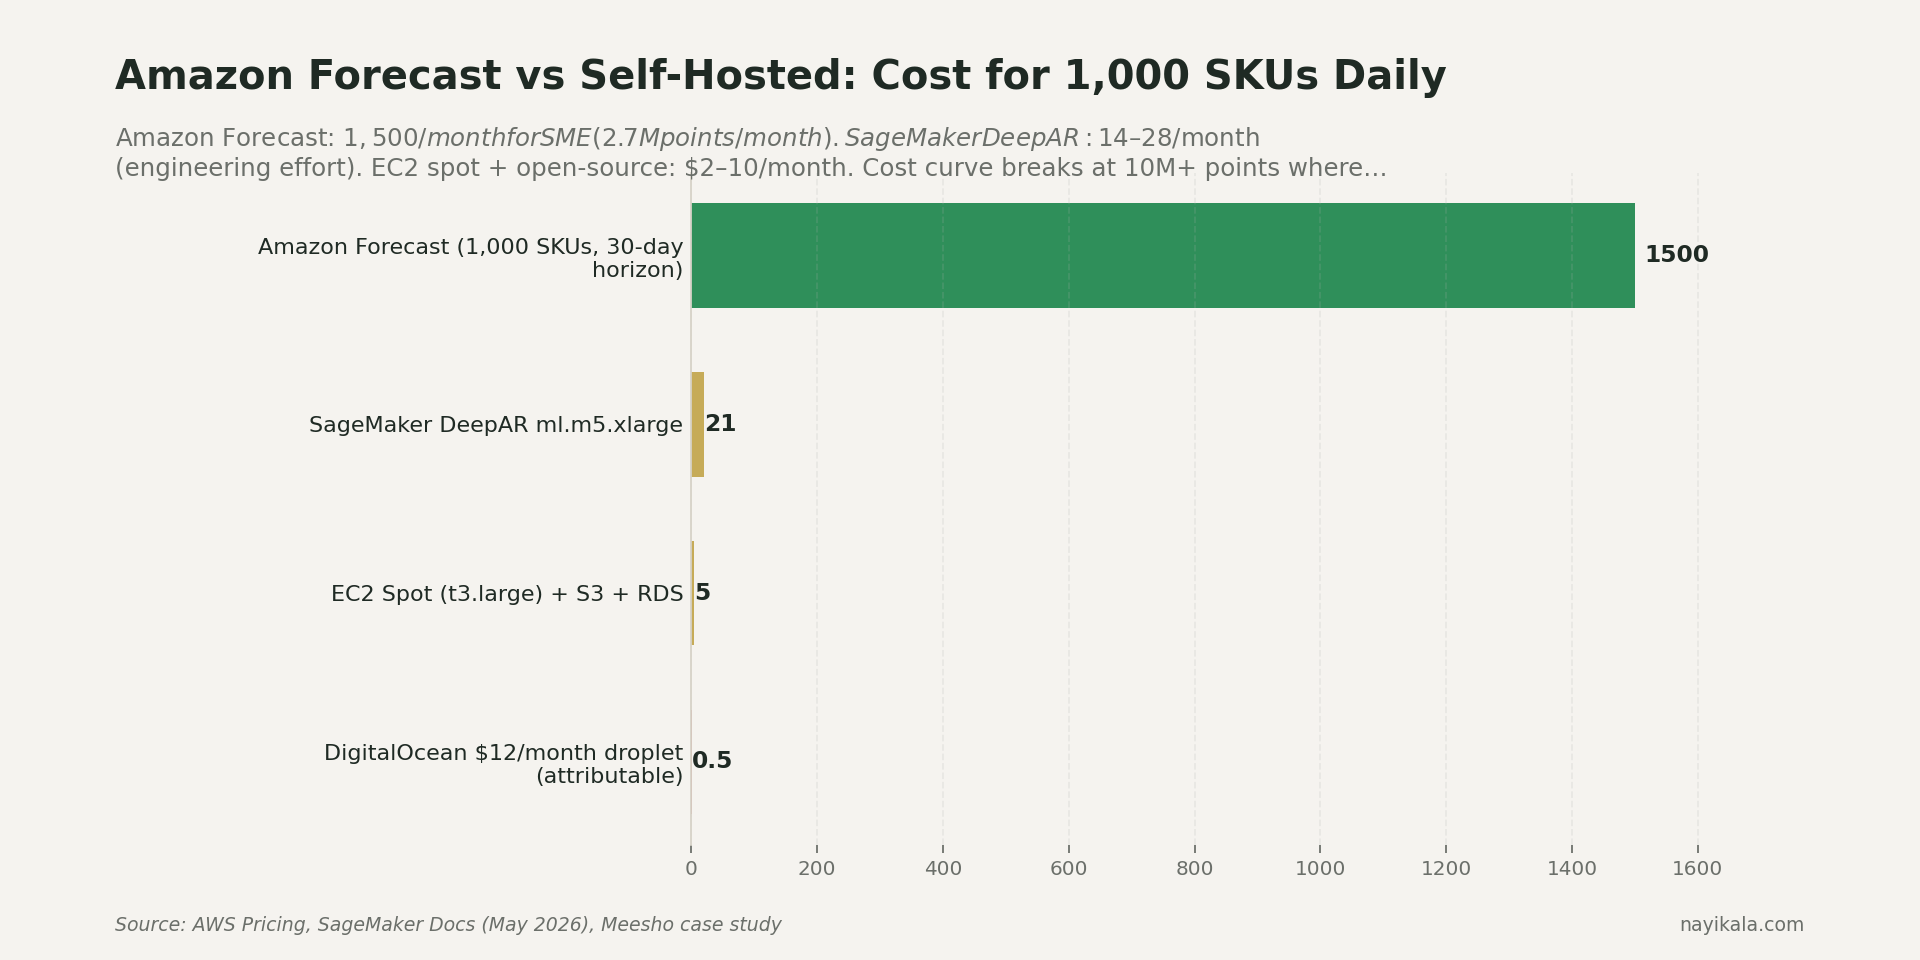
Amazon Forecast handles holidays better, and Meesho has publicly cited a 20% forecast accuracy improvement after switching to it (AWS case study). But the economics don't work for SMEs. A worked example: 1,000 SKUs × 3 quantiles × 30-day horizon × daily run = 2.7M forecast points/month. At Amazon Forecast's tiered pricing, that's roughly $1,500/month for compute alone. The same workload on a t3.large EC2 spot instance with self-hosted LightGBM is $5-10/month. Two orders of magnitude difference. Forecast makes economic sense at 10M+ points/month — i.e., Myntra/Meesho scale, not yours.
What you can do this week, for free
Four things to do this week on your existing stack, before any architecture changes.
1. Pull last year's daily sales by SKU and overlay it with the actual Hindu and Islamic calendar. Not Google Calendar's India holidays — that file misses Onam, Karva Chauth, regional Navratri. Use Calendarific's free tier (500 calls/month is enough), or the open-source Panchangam library which computes festival dates from Swiss Ephemeris. Mark each SKU's lift in the -15 to +5 day window around Diwali, Raksha Bandhan, Ganesh Chaturthi, Eid, Onam, Pongal — whichever match your customer geography. You'll see the asymmetry immediately.
2. Switch your Prophet model to multiplicative. One line:
m = Prophet(seasonality_mode='multiplicative')
Then add custom holiday rows with asymmetric windows: lower_window=-10, upper_window=2 for Diwali on a gifting SKU. lower_window=-7, upper_window=0 for Eid apparel. lower_window=0, upper_window=3 for Holi colour powders. Per-holiday prior_scale between 0.5 and 5.0 — the default 10 is almost no regularization, which is why your model treats every minor festival like Diwali.
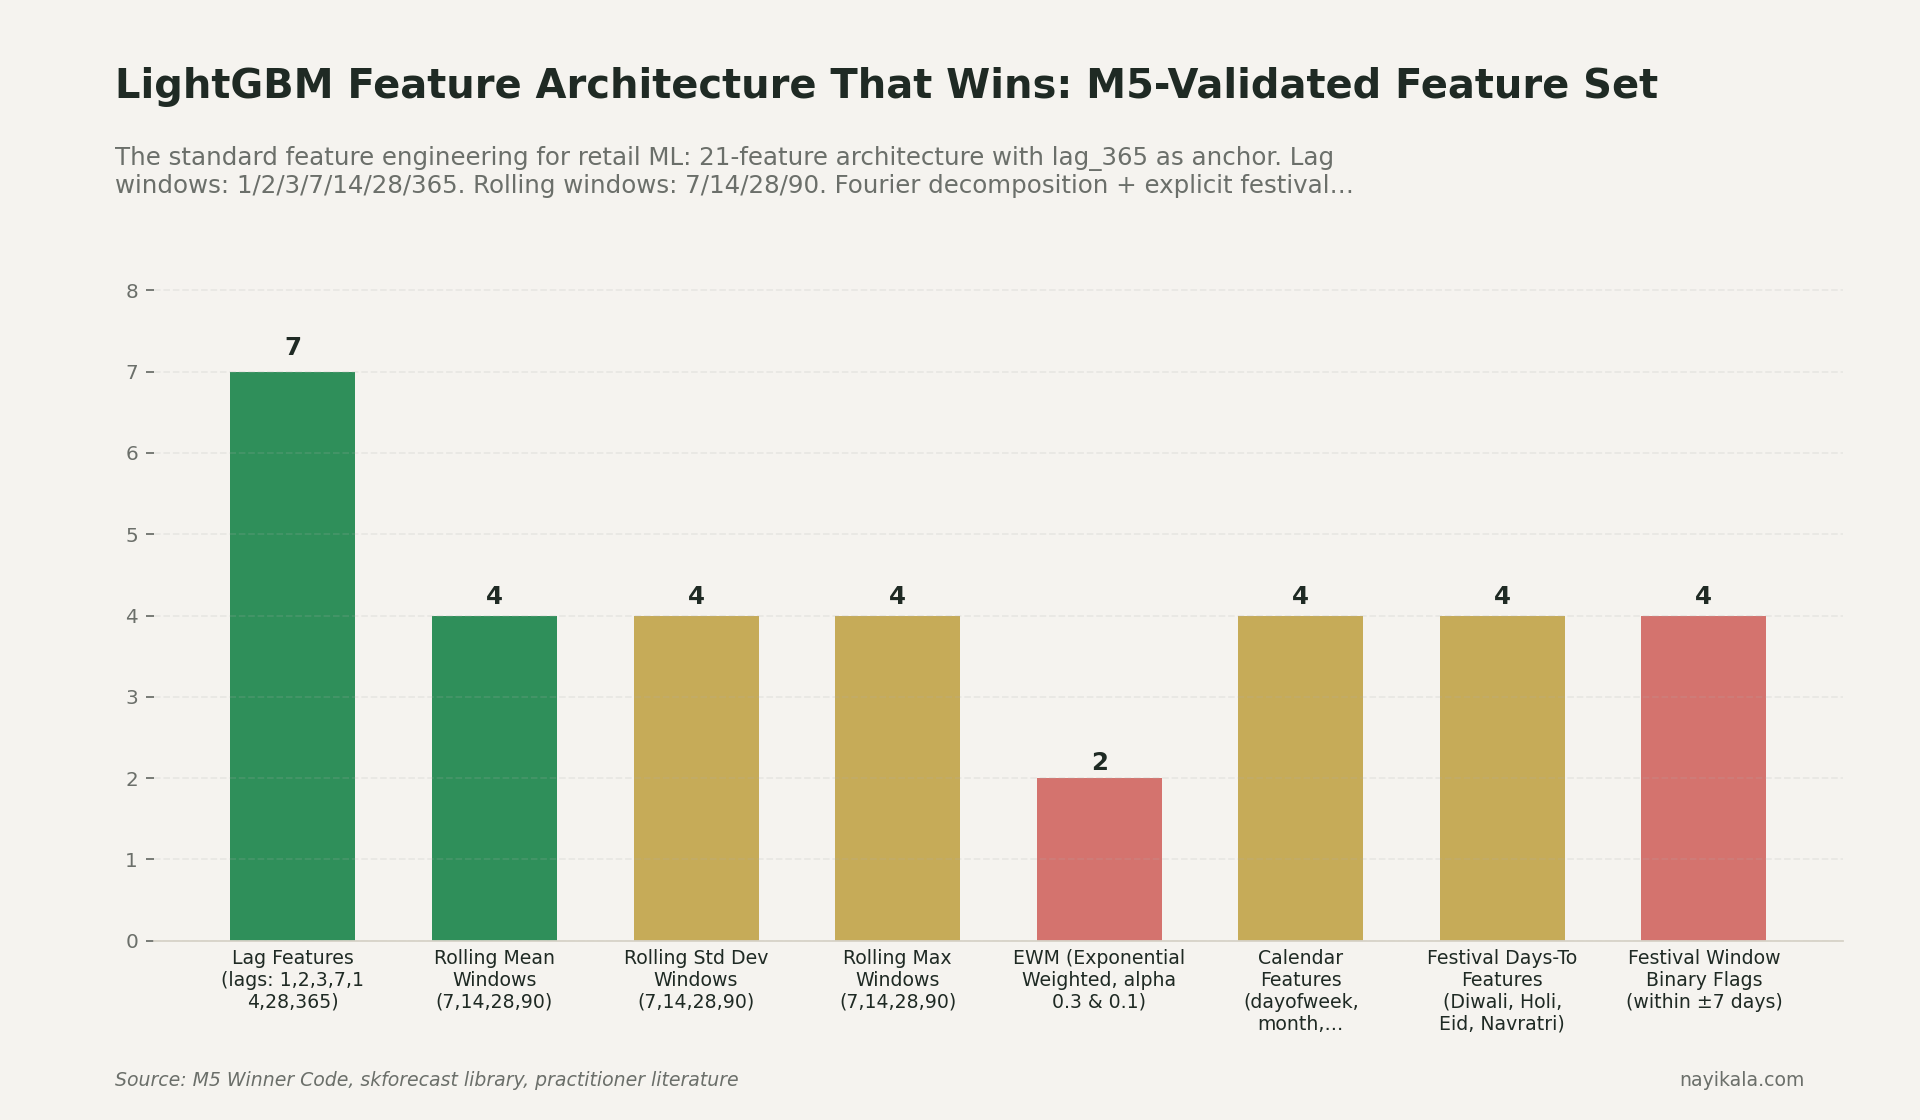
3. Build a lag_365 feature. If you're using any tree-based model, the single most important feature for annual seasonality is the value 365 days ago. M5 winners used lag_364, lag_365, lag_366 to handle year-length variation. Models without these systematically miss Diwali magnitude.
4. Pull Google Trends for your top three categories. Use pytrends-modern (github.com/yiromo/pytrends-modern) — the original pytrends was archived in April 2025 and most blog posts you'll find on Stack Overflow point to dead code. Trends has been shown to reduce out-of-sample retail forecast error by ~9% across multiple peer-reviewed studies, and it's a leading indicator — searches for "diwali gift hampers" peak 2-3 weeks before transactions do.
These four steps will get you from "structurally blind" to "structurally aware." Your forecast won't be perfect, but it will stop being systematically wrong in the same direction every year.
Where it gets harder
The four fixes above remove the worst systematic errors. They don't get you to a forecast you can plan capital against.
Then there's the engineering layer most SMEs hit and don't know how to cross.
The full feature stack for a festival-aware model needs Agmarknet mandi prices (rural purchasing power signal — free via data.gov.in), IMD or Open-Meteo weather (the 2025 monsoon arrived May 24 — eight days early, the earliest since 2009 — and that cut the South India cooling-product season by two weeks for Voltas, Blue Star, Havells), MSP announcement dates as sentiment shocks, festival categorical encodings with regional variants, and city-tier features because Tier 2/3 Diwali FMCG spikes don't look like Tier 1.
Then there's the hierarchy problem. During Diwali, your category mix shifts dramatically — sweets and gifting spike while staples stay flat. A top-down forecast disaggregating by annual-average proportions misallocates badly inside the festival window. Nixtla's HierarchicalForecast MinTrace reconciliation with festival-conditioned covariance handles this; static-proportion top-down does not.
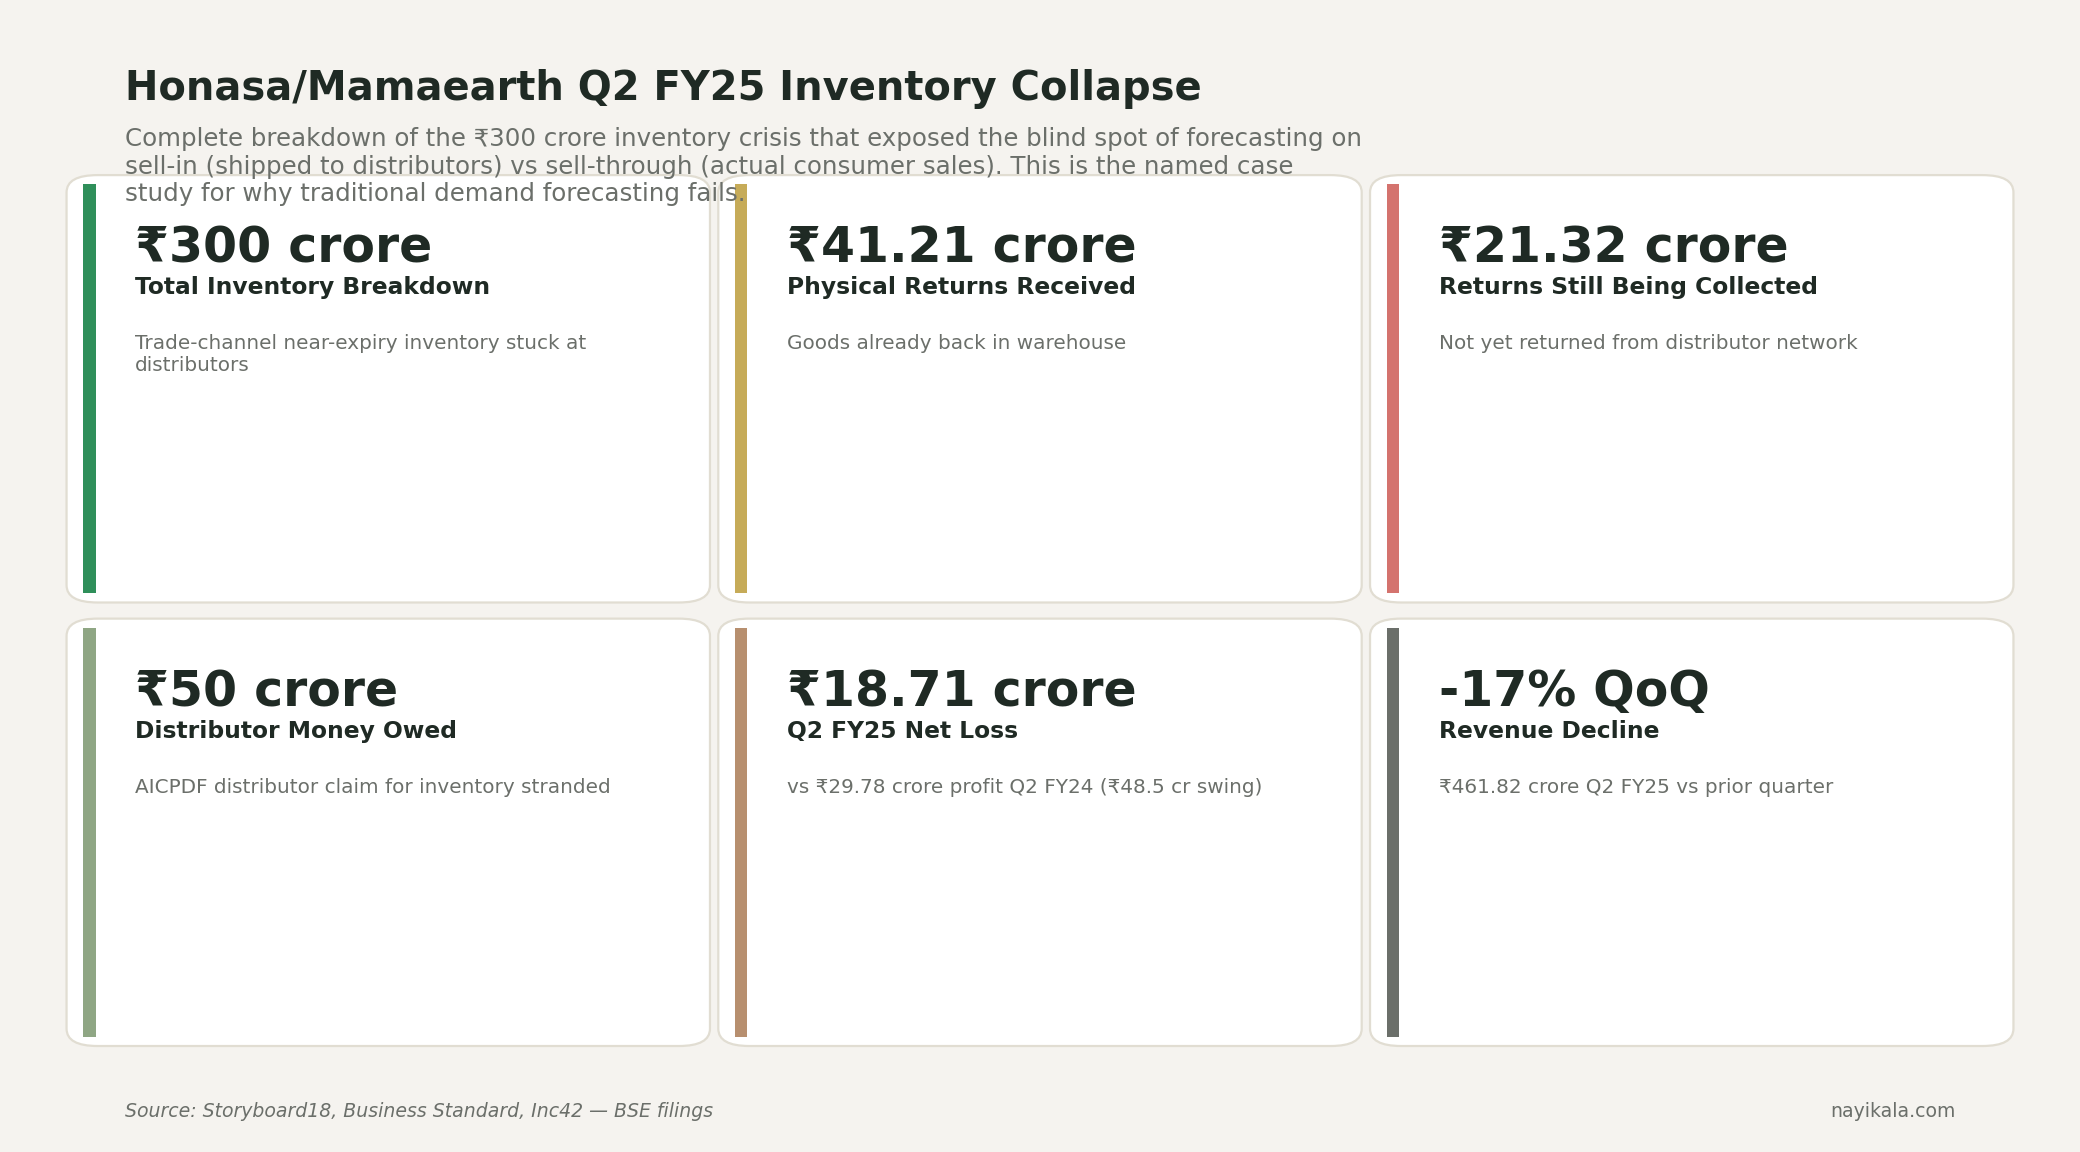
Then there's the source-of-truth question that broke Mamaearth. In Q2 FY25, Honasa took a ₹63.51 crore sales return provision because their forecast was running on system-level sell-in data — what shipped to super-stockists — not sell-through data, what actually reached consumers. Varun Alagh said it himself: "Most of our understanding was from the system inventory… all of that has resulted in a higher net inventory take back compared to what we had estimated." The ₹141 crore inventory pile-up was invisible until Project Neev forced reconciliation. Same forecasting blind spot, different layer of the data pipeline. If your model is fed Tally sell-in numbers, it's modelling shipments to your distributor, not demand from your customer. The forecast can be technically correct and operationally useless at the same time.
The pipeline that actually works — Tally XML agent on local LAN polling Sales Register, Shopify GraphQL hitting the 1,000-point/min bucket, SP-API daily Reports for the marketplace cut, all landing in S3, joined against a panchangam-derived calendar, fed into a hierarchically reconciled LightGBM ensemble with sell-through ground truth — is the layer SaaS dashboards don't expose and analyst notebooks don't finish.
The unresolved part
The exact gap between what Prophet's bell-curve Fourier decomposition can represent and what a Diwali demand curve actually does — multiplicative, biphasic, ending in a cliff — is where the engineering decisions live.
Related reading
← All posts